
The Financial Statement Analysis of Commercial Banks in Bahrain: A case study of Ahli United Bank
ABSTRACT
Financial sector of kingdom of Bahrain intensely supports the growth of the economy. It contributed 27% of Bahrain GDP in 2018.The wellbeing of an economy can be examined by financial performance of the bank. Financial performance is the result of its policies and operations in monetary terms. The aim of the study is to examine the financial performance of the banks in Kingdom of Bahrain- A Case study approach. For the evaluation of the performance of bank, secondary data was collected from the annual audited report of the bank for the period of 2011 to 2017. It focuses on two important indicators the profitability and liquidity. As the shareholders are in need to maximize their return on investment and the depositors need to get back their savings according to their needs focuses on liquidity. To measure the profitability, return on asset and return on equity is the variable and loan to deposit and loan to asset to evaluate the liquidity. For this ratio analysis is being used to measure as it is evident from the previous studies. The study used percentage analysis, descriptive statistics and correlation the result of the analysis portrayed that return on asset and return on equity are positively correlated and negatively correlated with loan to asset.
keyword
Financial performance, profitability liquidity, banks, Kingdom of Bahrain, return of equity
RESUMEN
El sector financiero del reino de Bahrein apoya intensamente el crecimiento de la economía. Contribuyó con el 27% del PIB de Bahrein en 2018; el bienestar de una economía puede ser examinado por el desempeño financiero del banco. El desempeño financiero es el resultado de sus políticas y operaciones en términos monetarios. El objetivo del estudio es examinar el desempeño financiero de los bancos en el Reino de Bahrein: un enfoque de estudio de caso. Para la evaluación del desempeño del banco, se recopilaron datos secundarios del informe auditado anual del banco para el período de 2011 a 2017. Se centra en dos indicadores importantes: la rentabilidad y la liquidez. Como los accionistas necesitan maximizar su retorno de la inversión y los depositantes necesitan recuperar sus ahorros de acuerdo con sus necesidades, se enfoca en la liquidez. Para medir la rentabilidad, el rendimiento sobre el activo y el rendimiento sobre el patrimonio es la variable y préstamo a depósito y préstamo a activo para evaluar la liquidez. Para esta relación, el análisis se está utilizando para medir, como es evidente en los estudios anteriores. El estudio utilizó análisis porcentual, estadísticas descriptivas y correlación, el resultado del análisis retratado que el rendimiento del activo y el rendimiento del patrimonio están correlacionados positivamente y negativamente con el préstamo al activo.
Palabras clave
desempeño financiero, liquidez de rentabilidad, bancos, Reino de Bahrein, retorno de capita
Introduction
Bahrain, the island of pearls and it is considered as the financial hub of GCC countries. The financial sector of the country is well-built and diversified. It provides extensive array of financial products and services, this makes the region as the leading financial center in the Gulf region. Bahrain has only oil and gas as the natural resource. The country was heavily depending on this income to stabilize the economic growth. Rather than that the financial sector is the one which supports the economy. The GDP for 2017 was US$35.3 billion which shows a growth rate of 9.8% compared to the previous year. The financial sector contributes 16.7% GDP in 2017 and 27% of Bahrain's Gross Domestic Product (GDP) in 2018, it also moves in a positive direction as the assets increased to US$188.2 billion in 2018 according to Central Bank of Bahrain.
The business sector of a country is the one which supported in the growth of the economy Finance is the life blood of every business activity. The life of any business depends on certain decisions. To take necessary decisions related to financial aspects will be based on the financial statements. These decisions add economic value to their business and help achieving the economic and social objectives of increasing the wealth of the common stockholders. Financial decisions are very crucial and is important to take right decisions at right time, the managers apply different tools and techniques that are useful in planning and controlling. The decisions taken by the shareholders to increase or decrease their investment and the decision by the business people, or the clients will also affect the performance. Like all other entities for the bank also its quite important to increase the wealth of the stake holders and to maximize the profit.
The managers of the banks too involve such valuable decisions to their banks that are operating in a global competitive finance and business world. In this aspect the latest study is pointed at to discover “Financial Performance Analysis of the Banks. For this Ahli United Bank is selected as the sample.
Theoretical framework
Literature Review
Aarma et al (2003) in their study mentioned that for the successful transition of financial sector in the economy bank performance is an important issue that have noticed.
Alshatti (2014). According to his study based on liquidity management it is noted that assets with higher liquidity affect business profit and an improvement in the return of mutual funds lead towards growth and success of Jordanian banks.
Ahmed Rafiq (2016), established in his study with relationship to profitability and liquidity evident from the sample taken that there is a direct relationship between the variables such as- profitability and net operating capital and liquidity.
Alumani et al (2014) in his study related to comparison of financial performance in Saudi banks argued that an increase in the operating income results in profitability whereas increase in cost, operating expenses and assets all decrease profitability.
Alsamaree (2013) study based on Kuwait banks about the profitability, it was concluded that even during the catastrophe period of 2007 to 2010, the performance of commercial banks was good and were able to dispense the profits.
Bansal.R (2014) discusses in his study that financial performance can be established only when there is an effective relationship between the financial statement and the income statement. study of financial performance is important in measuring busines’s success and reliability of the system.
Bennaceur & goaied (2008) measured the performance of the banks based on net interest margin (NIM) and return on asset (ROA). Their study concluded that NIM, Cost efficiency and profitability have significant influence across the Middle East and North African countries.
Bourke (1989) have made a study based on banks in Europe by collecting the data for 10 years about the concentration and determinants of banks profitability. By analysing the data for 90 banks in Europe, North America and Australia, it is evidenced that a positive relationship between profitability and liquidity.
Eljelly (2004) conducted an empirical study on trade-off between liquidity and profitability based on joint companies in Saudi Arabia, In his study the relationship was measured on two indicators current ratio and cash gap ratio. The result of the study revealed that there is negative relationship between two.
Kosmidu et al (2007) observes the profitability with different banks based on their asset size. They used return on equity to measure the profitability with respective bank asset size. They examine Greek bank for analyzing the study for six year.
Objectives of the Study
General Objective:
This is a case study about the performance of Ahli United Bank. The financial analysis will be based on the recent accounting periods, which are the last 7years ended 31st, December 2017.
Specific Objectives:
- To present an overview of Ahli United Bank
- To interpret the financial statements
- To identify ratio analysis profitability and liquidity as an effective tool to measure the performance of bank
- To analyze the profitability and liquidity of Ahli United Bank
- To analyze the financial performance of the bank
Profile of Ahli United Bank
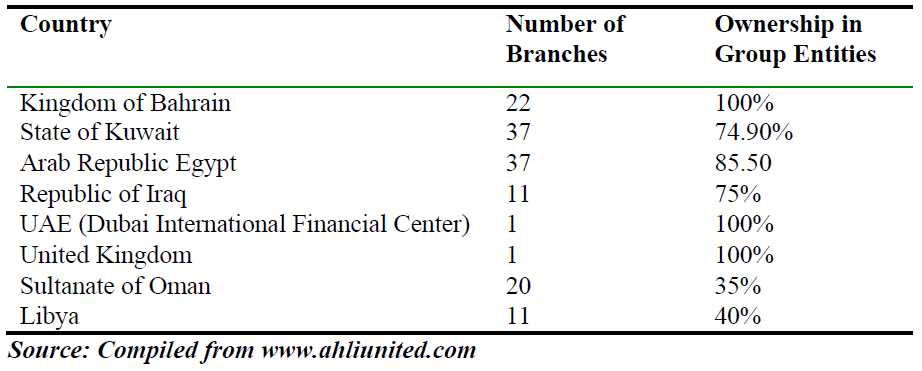
The Ahli United Bank B.S.C (AUB) is head quartered in Al-Seef district, Kingdom of Bahrain. It started its operation as a closed company on May 31st 2000 and later in July 2000 changed to public share holding company. The bank and its subsidiary are collectively called as “Group”. The bank is involved in diversified services such as global fund management, commercial, Islamic and investment banking activities, retail business, life insurance business and private banking services. The Bank functions under a retail banking license issued by the Central Bank of Bahrain.
The principal subsidiaries of the banks of with ownership in group entities.
Table 1. Ahli United Bank
Methodology
Research Methodology
The present study uses the Case Study approach. The financial statements for the year 2010 and 2017 have been taken from the bank’s financial reports and other sources such as interviews with officers of the bank and from other related journals, magazines, articles from websites, e-book, e-journal, conferences and symposiums and proceedings.
Research Design
Case study is a kind of business research that aims to explore in depth of an event. It is an approach of understanding the dynamics present within one setting. The case study method of research is an attempt to analyze people, events, decisions, time period, projects, procedures, firms, or other systems that are studied partly or completely using one or more methods. This research study is analyzing about an institution. The aim of the research is to evaluate how far the financial analysis using ratios are useful in measuring the profitability and liquidity of the bank.
Case study as a research methodology can be practically applied and it provides place for expansion and generalizing theories; it uses both the existing and theoretical knowledge with new empirical insights and many researchers have the opinion that this method has great scope of application in developing new layers of reality, and developing new, testable and empirically valid theoretical and practical insights. Case studies are more useful to be innovative, descriptive, and in building relationship, as well as the same could be used for theory testing, refutation, refining.
Research Instrument and Techniques
Both primary and secondary data has been used for the current study. Primary data were collected through the structured schedule based on survey method. Where as secondary data were collected from the financial reports of the Ahli United bank period from 2010 to 2017.
The bank annual reports served as a secondary source of ready information about the various financial aspects of the bank. Since the researcher has heavily dependent on published reports of the bank, it was easy to gather the relevant information at a minimum cost and effort. Seven years staring from 2010-2017 annual reports will be considered for collecting the required financial and firm related information.
Profitability
Profitability ratio is one of the most significant tools used to measure banks performance.it is mainly used to evaluate the capability of the firm to generate the earnings in association with its expenses and related cost during a specific time period. Profitability ratio is considered as the basic financial ratio in measuring the performance and effectiveness of banks in terms of profit and its operations.
Profitability of Ahli United Bank is measured for the study based on the following.
- Return on Asset (ROA)
- Return on Equity (ROE)
In addition to this to measure the efficiency cost to Income ratio (C/I) is also used.
Return on Asset
It is the primary ratio calculated based on the asset employed in the business with the profit generated. This is an indicator to the stake holders as well as the management to assess the performance. About the general principle that high-risk high return; banks preferred to have high return which shows that maximum utilization of assets to generate a high return. It depends on the management as well the efficient utilization of resources.
Data Presentation and Analysis
Under this section we have used inferential and descriptive statistics for analyzing the data. Table 2 presents the summary of the descriptive statistics the variables being studied. The data belongs to the seven years starting from 2011 to 2017. The descriptive statistics are presented as follows:
Table 2. Descriptive statistics
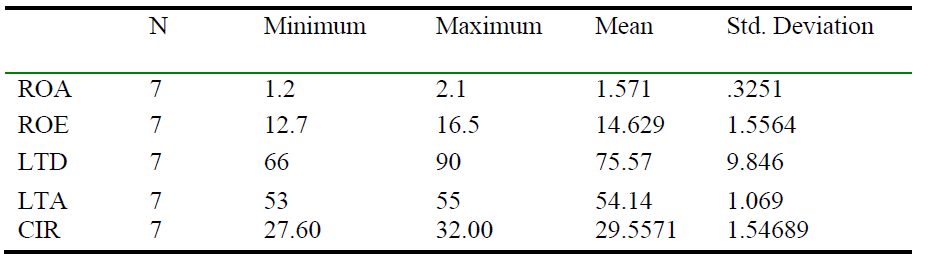
The results in Table (2) show that, the mean value of the return on assets for the selected years was 1.57 while 1.2was the minimum and 2.1 was the maximum. As the average value of return on equity was 14.63, while 12.7was the minimum and 16.5was the maximum. The average value of loan to deposit was 75.57, while 66was the minimum and 90was the maximum.
As we can also see that the mean value of loan to asset was 54.14, while 53was the minimum and 55was the maximum. The cost to income ratio reaches a maximum of 32.0 and a minimum of 27.60. The volatility for C/I ratio was 1.54.
Table 3. Return on Asset
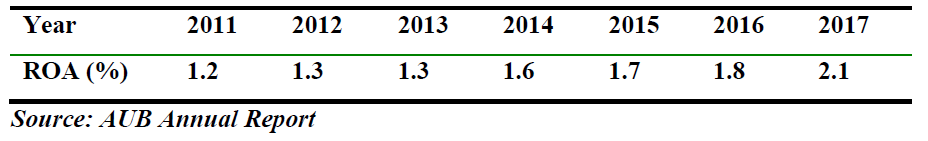
Table 3.4 depicts the percentage return on asset for seven years it shows a tremendous growth for all the years. From 2011 to 12 it shows an increase of 1%and remains unchanged in 2013 and after that up to 2017 didn’t turn back. It shows a positive signature. It is computed by using the following formula. It is well explained in table 3.5.

ROA-Net Income to Total Asset
Table 3.5 portrays the net profit against total asset for the last seven years. It also provides the percentage growth of net profit earned and the total asset. The lowest growth rate to total asset was recorded in the year 2016 while the highest was recorded in the year 2013.As the total asset increased the net profit for the year also shows a huge increase for 2013.Whereas the decrease in asset in 2016 didn’t affect much on the profit but shows a decline compared to the previous year.
Table 4. ROA-Net Income to Total Asset
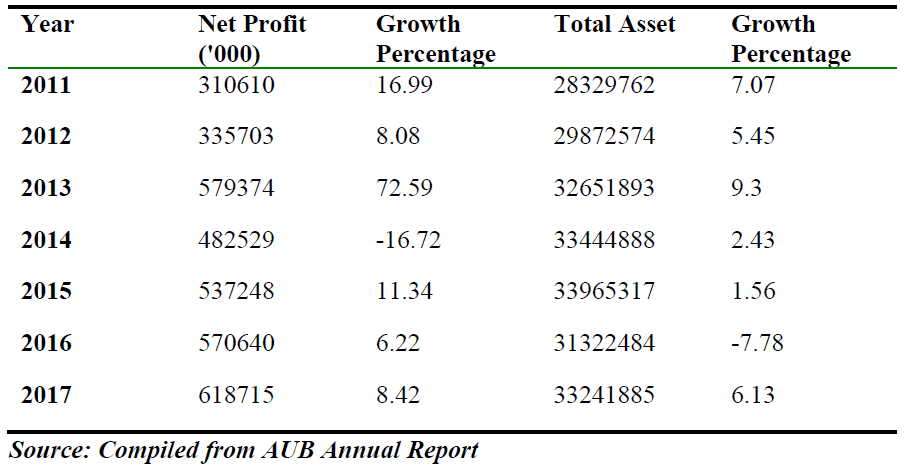
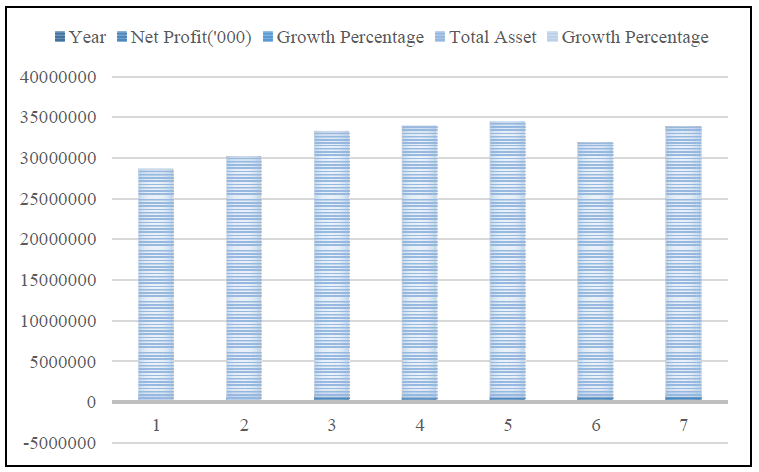
Figure 1. ROA-Net Income to Total Asset
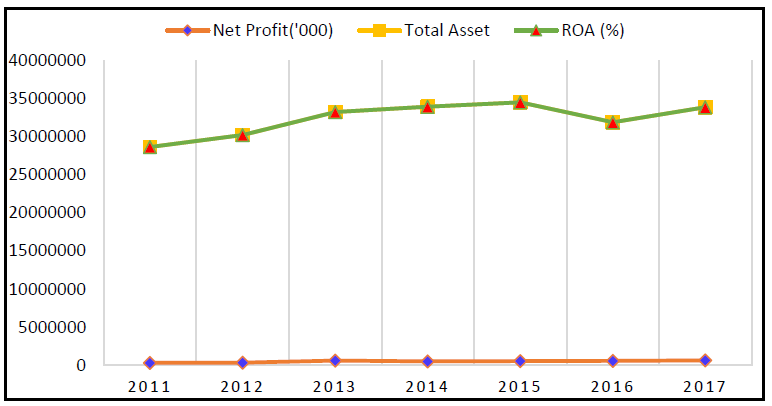
Figure 2. Net profit in comparison with total asset and return on asset
Return on Equity (ROE)
It indicates the return for the shareholders for their investment. For high growth companies generally, it shows high. It arises due to high financial leverage or an increase in return on asset.

Table 5. Return on Equity
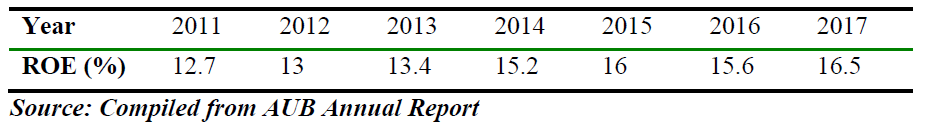
Table 3.6 portrays the percentage return on equity for seven years it shows a tremendous growth for all the years. In 2016 it shows a slight decrease but when we compared from 2011 to 2017 it depicts growth of 3.8%. It is computed by using the following formula. It is well explained in table 3.6.
Table 6. ROE-Net Income to Total Equity
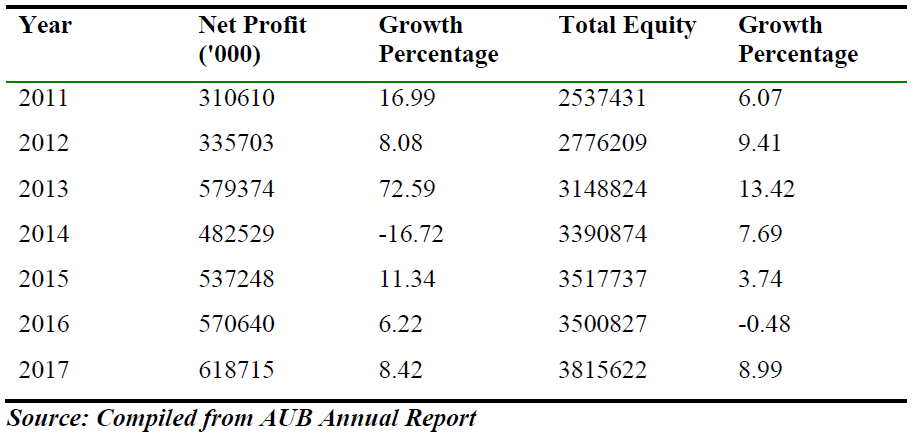
Table 3.7 and the following figure 2, portrays the record of uppermost increase in equity during 2013.During the year the net profit, return on asset and financial leverage was also at the peak. The return on equity depends on return on asset and leverage. From 2014 onwards all the determinants were decreasing. The growth percent of equity compared to the previous years it was negative in 2016 and by 2017 it shows a positive signature. The net profit increased by 8.42% in 2017, parallel the equity also increased by 8.99% a 0.57% increase.
Among the history of seven years the shareholders earned a good return in 2013 and it is showing change by 2017 a prospective look for the investors. In turn it shows an increase in the efficiency of performance of profitability.
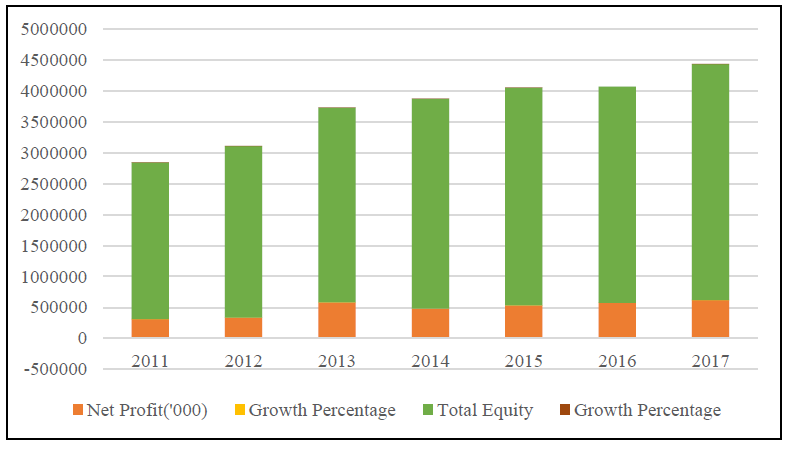
Figure 3. ROE-Net Income to Total Equity
Table 7. Financial Leverage and Net profit margin
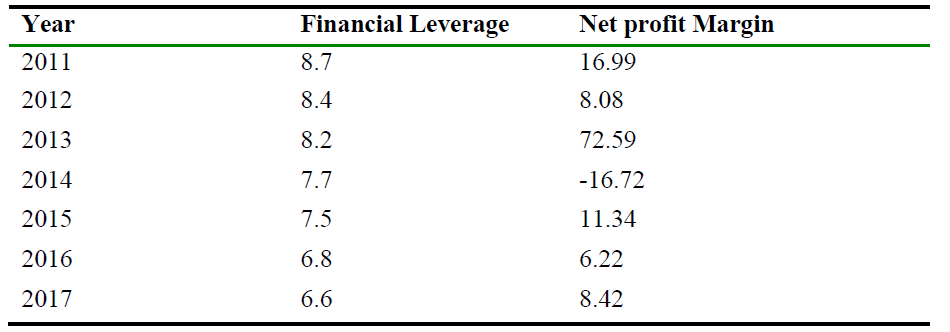
Another tool to measure firm’s debt utilization is financial leverage that helps understanding the use of fixed costs.
Higher financial leverage increases the financial risk resulting from inability to meet fixed costs.
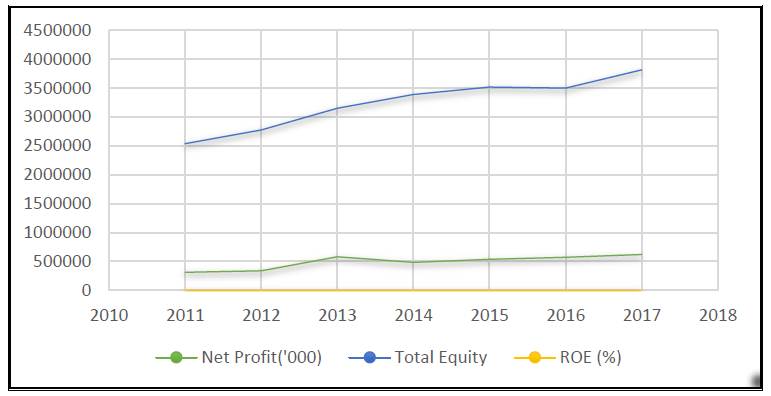
Figure 4. Net Profit to Total Equity
The above figure portrays the return earned by the equity holders for their investment. Return is the one which attracts the shareholders to withstand with the firm. There was a tremendous growth in the return from 2011 to 2015 and in 2016 it is slightly declined and in 2017 it is increasing as well.
This increase in return on equity for these years is due to the increase in net interest margin. And on the other hand, due to financial leverage, the bank is in a position to provide more debt out of the equity capital there by raising the interest income.
Research Findings and Conclusions of the study
This is a case study about the role of financial analysis for performance evaluation of Ahli United Bank. The financial analysis will be based on the recent accounting periods, which are the last 7 years from 2011 to 2017.
The result of the interview related to ratio analysis as a tool for measuring profitability and liquidity is summarized as follows:
Table 8.
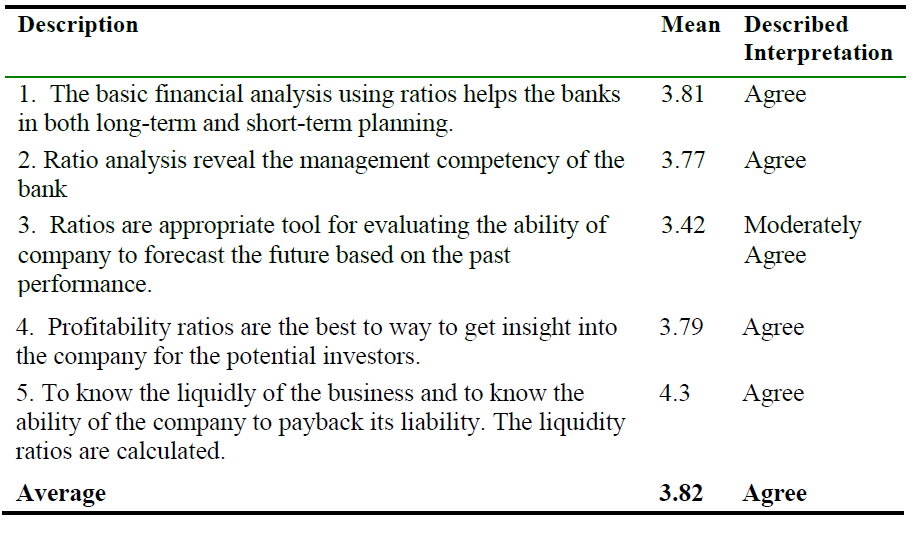
The above Table portrays the results of the unstructured interview conducted among the officers of Ahli United Bank. The officers of different departments of the bank have unanimously agreed that the financial tool of ratios is useful in the bank planning to day to day operations, investment decisions to risk management and liquidity to debt management of the business.
It also conducted on the importance of ratio analysis from the bank officials of the Ahli United bank and the result of the interview related to ratio analysis as a tool for measuring profitability and liquidity is summarized as follows:
- 76.2% of the officials agree that the basic financial analysis using ratios helps the banks in both long-term and short-term planning.
- 75.4% official agree that Ratio analysis reveal the management competency of the bank.
- 68.4% bank official agree that Ratios are appropriate tool for evaluating the ability of past financial statement in forecasting future performance.
- 75.8% agreed that investors normally look into ratio for their investment decisions.
- An overwhelming number of bank officials (86%) agreed that firm’s liquidity measure provide adequate information for decision making.
Conclusions
Financial statement analysis is a robust tool for understanding bank’s performance and its liquidity.
Details taken from the annual reports of Ahli United Bank after the analysis it is noted that there is a gradual increase in the profit growth rate and only in one year it shows a slight decrease to profit, total asset and equity. Financial analysis also shows a positive correlation with return on asset, return on equity.